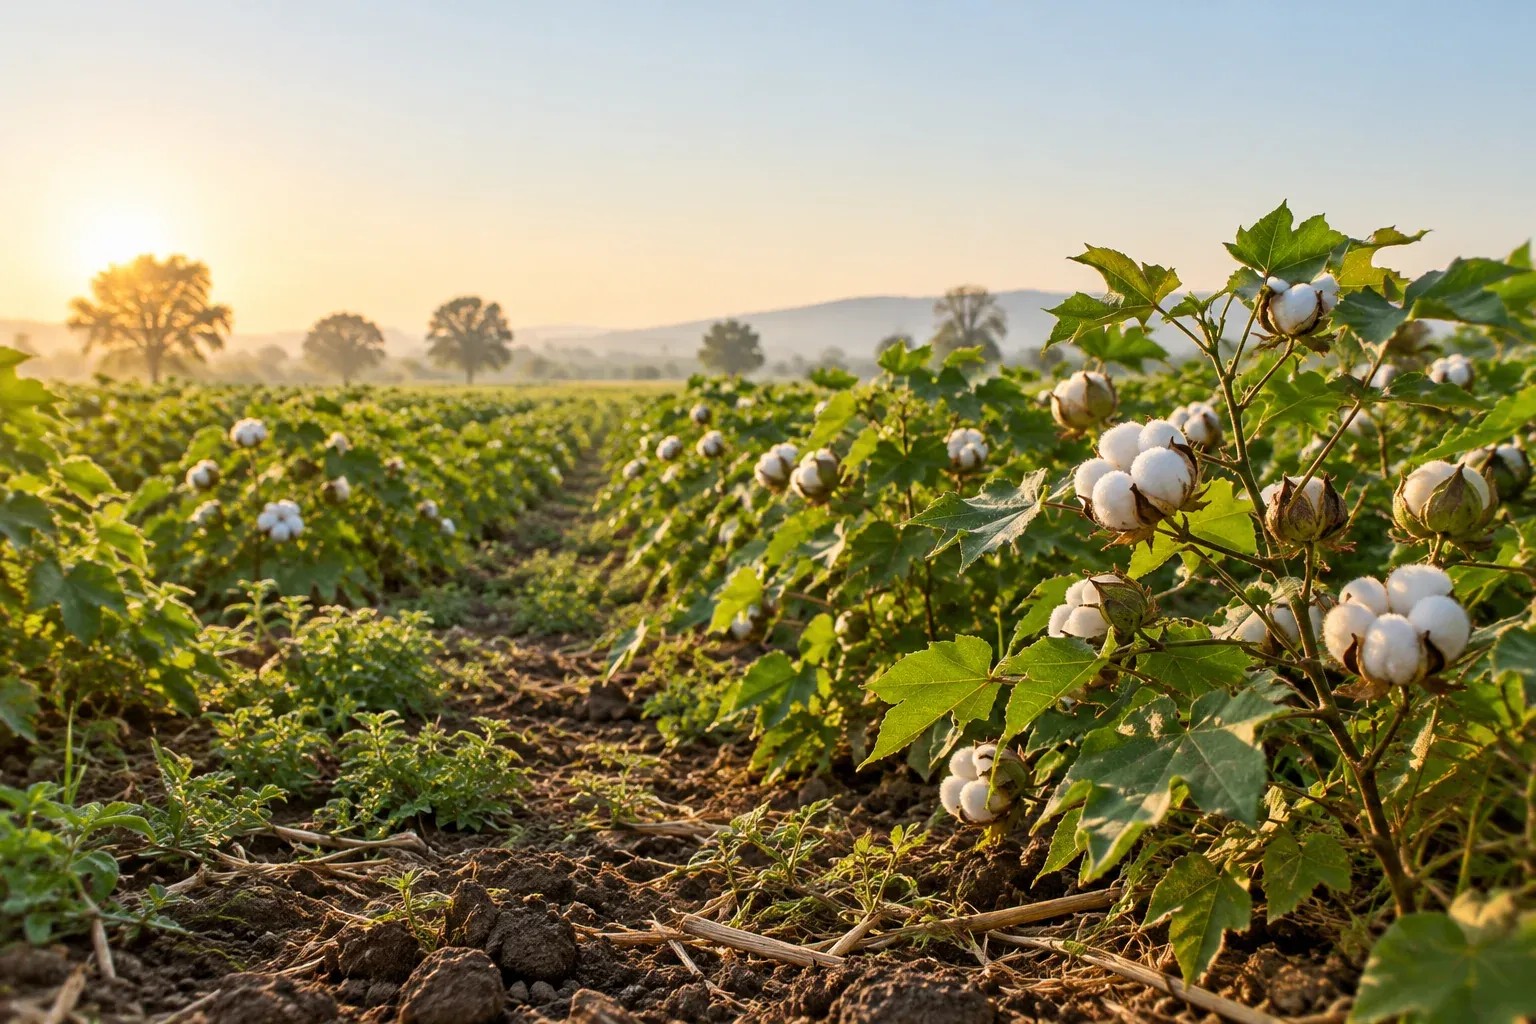
Crop Yield in Regenerative Farming: How Beetle Connects Practice and Productivity
In our 2025-26 programmes, participating farmers recorded about 18% higher crop yield and about 38% higher net annual income than control group farmers. Those figures come from Beetle Regen Solutions' own end-of-year report, which covers smallholder cotton farmers in Madhya Pradesh and Maharashtra, with first pilots now running in Bangladesh.
Crop yield is the amount of harvested produce from a given area of land, usually measured in kilograms per hectare. The 18% figure is a relative difference: participating farmers' yield per unit area compared with control farmers' yield per unit area.
This article explains which practices sit behind the crop yield numbers, how to read a comparison with control farmers, and where our results end and our goals begin.
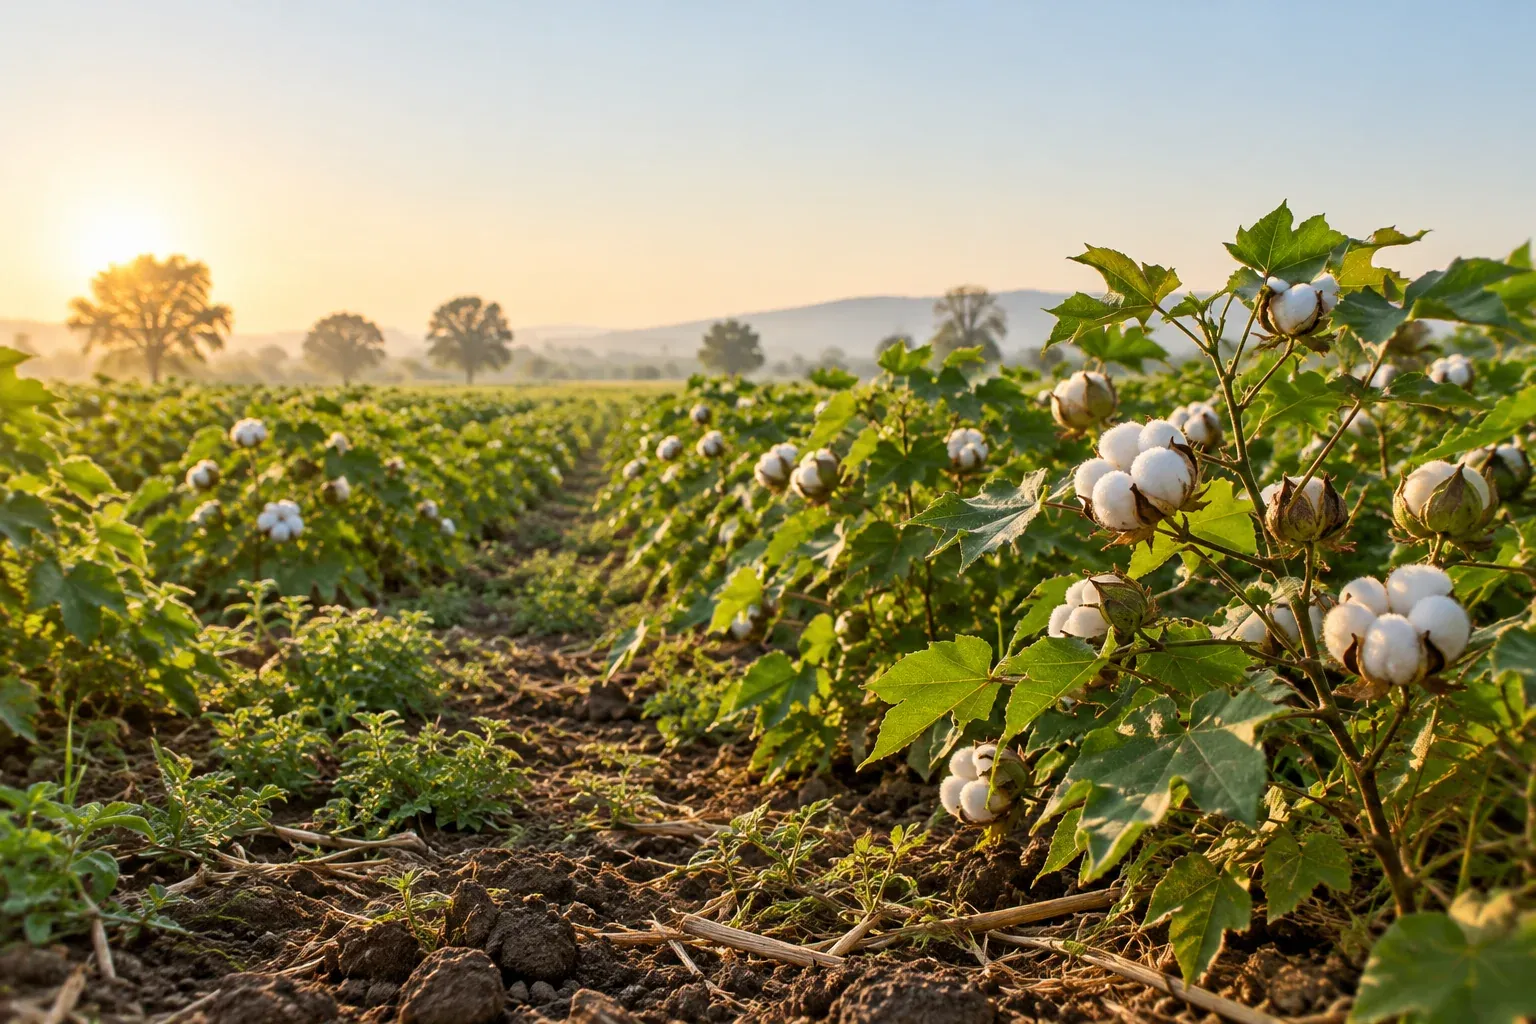
Why Do Productivity and Soil Health Rise Together on Smallholder Farms?
Productivity and soil health rise together because the same soil features that hold nutrients and water also carry a crop through dry spells and costly inputs. On smallholder farms of two to six acres, better soil structure can mean steadier yield with lower fertilizer spend, which is why farmers adopt regenerative practices once they see results.
Our CEO, Amol Mishra, puts it this way in the report: the future of agriculture is not a choice between productivity and sustainability, it is "productivity because of sustainability." Farmers in our landscapes did not adopt practices because a standard or a compliance team told them to. They adopted them because demonstration plots in the previous year showed good results.
The wider evidence points the same way. A UNCCD case study from Tamil Nadu reports that farmers moving to farmer-led natural farming saw improved soil structure and water retention, which lowered their vulnerability to drought.
Yield is not guaranteed by any single method, though. An ICAR-NAARM report for NITI Aayog found that natural farming, a different system from ours, has in general not shown higher yield than conventional farming. Context matters: crop, soil, rainfall and how well the practice is carried out.
What determines crop yield, and how is it calculated?
Yield is calculated as total harvest divided by the area harvested, for example kilograms of seed cotton divided by hectares. Several factors move it: crop variety and seed quality, soil fertility, water availability, pest and disease pressure, and climate and rainfall in the season. Regenerative practices mainly act on fertility, water and plant population, which is why we track them against control farmers.
What smallholders notice first
A smallholder does not judge a practice by a report. The test is simpler: does the crop stand better, do I spend less at the input shop, and is the harvest worth more at the end of the season? Our CEO describes the sequence as healthier soil, lower input costs, improved resilience and then better incomes.
That is why we pair yield with income and input data. A higher yield that needs much more fertilizer can leave a farmer no better off. A modest yield gain with lower input spend can still raise net income. Reading yield alone hides that difference.
Why the national picture makes this timely
Our report notes that the Government of India has approved the Mission for Cotton Productivity with a financial outlay of ₹5,659 crore. It aims to raise lint productivity from 440 kg per hectare to 755 kg per hectare by 2031. Reaching that target will depend on practices smallholders can actually adopt, which is where farmer-led methods such as HDPS and biochar come in.
Which Practices Does Beetle Use to Raise Crop Yield?
We combine several practices, each aimed at a different limit on yield: High-Density Planting Systems (HDPS) for plant population in cotton, biochar for soil fertility and water retention, Alternate Wetting and Drying (AWD) for water management in paddy, and wider regenerative practices such as intercropping, reduced tillage and boundary plantation.
The 2025-26 report notes that each participating farmer adopts four to five regenerative practices on the farm, and that 29% of farmers have adopted boundary plantation. Stacking practices is the norm, not the exception.
HDPS: more plants per acre, with the right seed
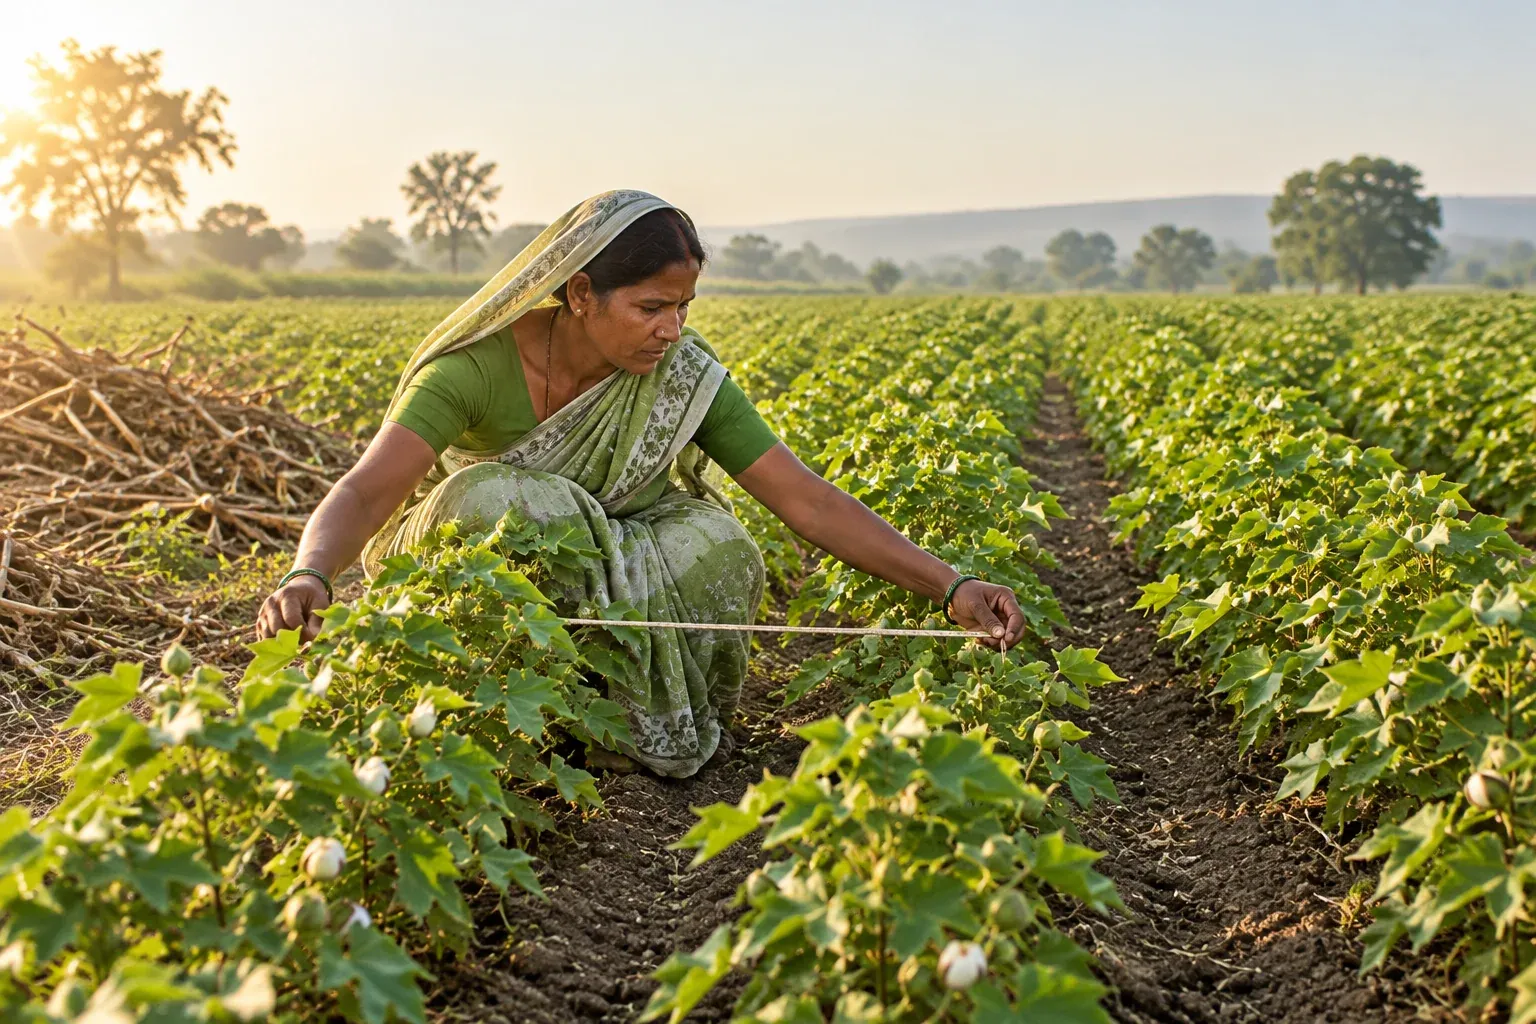
HDPS is a planting method that optimizes land use through closer, planned spacing. The technology is not new. The gap, as our CEO describes it, has been getting it to the smallholders who farm in remote areas, with the right seed and crop management.
The programme has reached more than 2,800 farmers across 2,100 hectares in Madhya Pradesh and Maharashtra. In Khargone alone, we have engaged 260 farmers. In an early-results section of the report, participating farmers reported an average cotton yield increase of approximately 25% compared with conventional planting. We treat that as an early, farmer-reported result. For the full method, see how high-density planting boosts cotton yield.
Biochar: turning crop residue into a soil input
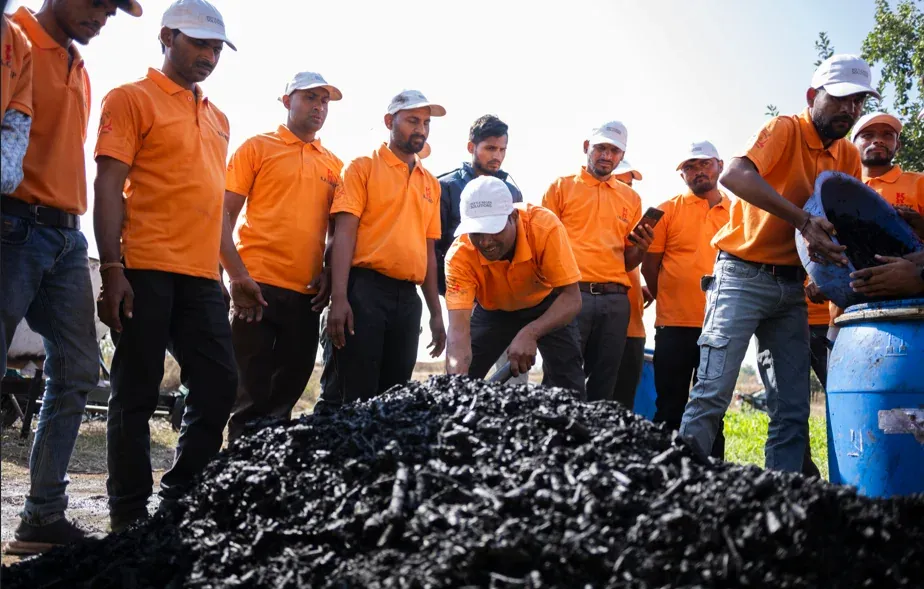
Biochar is made by burning organic waste, such as crop residue and dead plants, in a controlled, no-oxygen environment. In our programmes, cotton stalks that might otherwise be burned become a farmer-made product. We describe it as a nature-based way to improve soil fertility, sequester carbon and enhance water retention.
Biochar works on the slow side of yield: soil condition rather than a single-season jump. Our CEO calls cotton stalks one of the most underused climate assets on farms. Read more in our explainer on how biochar improves soil health in cotton farming.
AWD: water management for paddy
Alternate Wetting and Drying is our water management project for rice and paddy farmers in Andhra Pradesh. Its main targets are water and methane rather than yield. We state that AWD can reduce the water footprint of paddy farming by up to 30% and lower methane emissions by 48%. Those are technique-level figures, and they are not part of the control-group results in the next section.
What Did Our 2025-26 Field Data Show Against Control Farmers?
Our 2025-26 report shows yield about 18% higher and net annual income about 38% higher than control group farmers. Water use in cotton was about 16% lower than control farmers. Participating farmers also reduced chemical fertilizer by about 23% and avoided about 17% of greenhouse gas emissions per hectare.
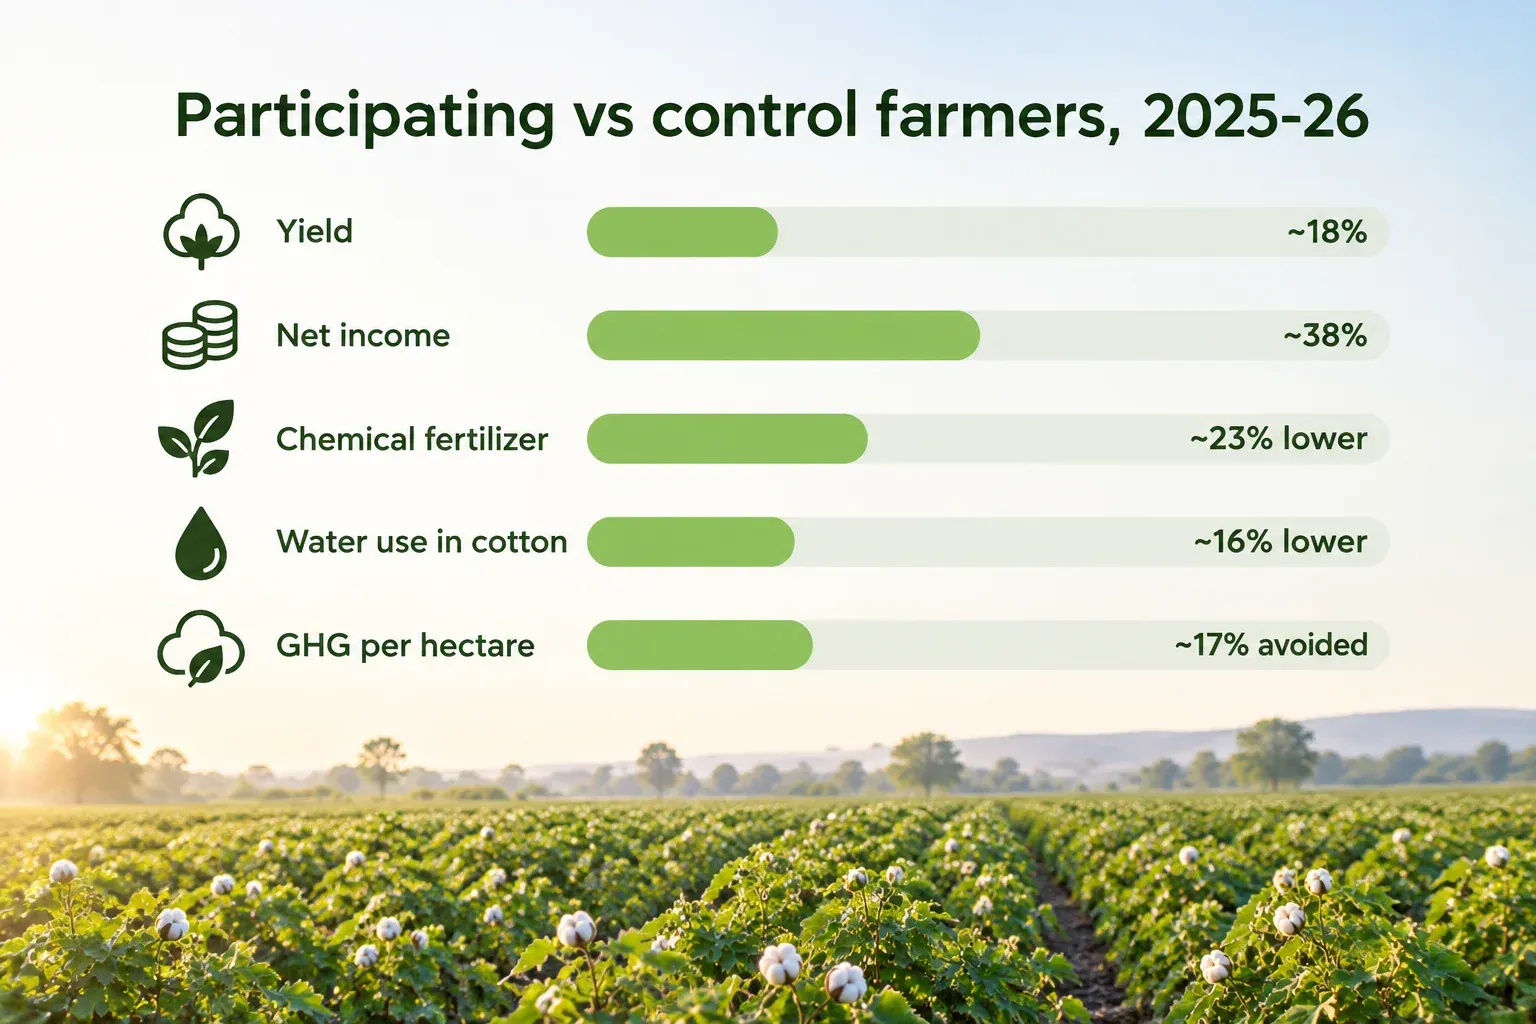
Here is how those results read, indicator by indicator, from the report's 2025-26 impact table:
- Yield: increased by about 18% compared with control group farmers.
- Net annual farmer income: improved by about 38% compared with control group farmers.
- Chemical fertilizer: about 23% reduction.
- Water-use efficiency in cotton: about 16% reduction in water use compared with control group farmers.
- Greenhouse gas emissions: about 17% avoided per hectare.
Income rose by more than yield. Lower fertilizer spend is one likely reason, since farmers pay less for inputs while selling a larger harvest. We read it that way, but the report does not break income down by cause.
How to read a control-group comparison
A control group is a set of similar farmers who did not take part in the programme. Comparing the two shows what changed because of the practices, not just what changed with the weather that season.
Here is a simple illustration, hypothetical and not a real farm. If a control farmer harvests 100 units from a plot, a participating farmer with an 18% higher yield harvests 118 units. The gain is the difference between those two plots in the same season, not a promise of 118 on any given farm.
When you see any yield claim, check four things:
- The comparison: is it against control farmers, or against the farmer's own past harvest?
- The season and crop: a cotton result does not transfer to paddy.
- The reach: which farmers are counted, direct or indirect?
- The practice: which of the four or five practices did the farmers actually adopt?
How the data are gathered
Data collection is a field job. Our partner, the Niranjanlal Agrawal Foundation (NAF), leads on-ground operations across the intervention states, including farmer mobilization, capacity building, demonstration plot management, field monitoring and data collection. That local presence is how we reach households and keep records consistent.
Our work also extends to measurement standards. We are conducting a cradle-to-gate life cycle assessment for Texprocil in Jalgaon, Maharashtra, covering 1,200 farmers, and it follows ISO 14040, ISO 14044 and ISO 14067. In Khargone, we work with Boomitra on digital monitoring of soil organic carbon.
Reach and limits of the results
The basis matters. Our work reaches approximately 120,000 farmers, of whom 71,000 are direct outreach and about 50,000 are indirect, reached through partner-led capacity building. The yield and income comparisons are for participating farmers against control group farmers, not for every farmer we touch.
Our report also names a limit. Practice adoption varies across geographies, so consistency needs continued handholding. Farmers who follow the practice closely should not expect the same gain as farmers who follow it loosely.
How We Separate Program Objectives From Measured Results
We label a number as measured only when it comes from our 2025-26 field data, with the comparison group named. Anything else is an objective: a target we work toward, such as an 18% income expectation or one million tonnes of carbon sequestered over three years. Objectives describe intent. They are not forecasts or guarantees for any farm.
Measured (2025-26 report):
- Yield about 18% and net income about 38% higher than control group farmers.
- About 23% less chemical fertilizer and about 16% less water use in cotton.
- HDPS early results: an average cotton yield increase of about 25% reported by participating farmers.
Objectives and stated expectations:
- HDPS, intercropping and biochar, together with regenerative agriculture, are expected to lift farmer income by at least 18%. This is a separate figure from the measured 18% yield gain.
- Sequester approximately 1 million tonnes of carbon over three years, including about 220,000 tonnes in the first year.
- Extend HDPS to more farmers, with matched seed linkages and crop management support.
What we do not promise
We do not promise a specific yield increase on your farm. Soil, rainfall, seed and how closely you follow the practice all change the outcome, and our own report says adoption consistency is still a focus area.
We also do not promise carbon income. The most common mistake we see is farmers joining a carbon project without fully understanding what participation requires, and assuming that joining automatically earns money from credits. Carbon revenue depends on project design, verified outcomes, credit issuance, market value, project costs and the agreed benefit-sharing mechanism. Our Nagpur soil carbon project, for example, is still in documentation and pre-validation.
Finally, our Bangladesh work is at pilot stage. We are not citing yield results from those pilots.
What Can Farmers and Sourcing Brands Do With These Results?
Farmers can start with one or two practices, record inputs and yield plot by plot, and compare against a neighbouring plot. Brands can ask suppliers for the comparison group, the season and the sample size behind every yield claim, and keep goals separate from measured results in their reports.
For farmers and cooperatives
A practical first season looks like this:
- Choose the practice that fits your crop. HDPS and biochar suit cotton; AWD suits paddy.
- Secure the inputs the practice needs. We have not published a biochar application rate, HDPS spacing or seed rate here, so confirm these with our team for your crop and soil before you buy seed. For HDPS that means matched seed and crop management guidance, not just closer spacing.
- Keep a field record for each plot. Note seed, inputs, dates and harvest weight so a comparison is possible.
- Plan the next season too. Our crop rotation guide covers rotation and intercropping for crop yield enhancement beyond one season.
- Ask about carbon before you sign. Find out what participation costs and how benefits are shared.
For brands and sourcing teams
- Request the control group definition for any reported yield or income gain.
- Separate reported results, early results and targets in your sustainability reporting.
- Check that direct and indirect farmer reach are reported separately.
- Look for a stated limit. A programme that names its adoption gaps is easier to trust than one that does not.
If you run a cooperative or source cotton and want to talk through how these practices could be measured on your plots, contact our team with your crop, region and number of farmers.