
Soil Health Regeneration: 6 Measurable Indicators Brands Should Demand from Suppliers
Soil health regeneration means measurable improvement in six areas: organic carbon, soil structure, water infiltration, nutrient availability, biological activity, and input dependency. Brands can verify soil health regeneration in a supply base only when suppliers track these six indicators over multiple seasons with lab and field tests, not when they simply repeat the word "regenerative" on a scorecard.
Key Takeaways
- Six indicators, not one: soil organic carbon, structure, water infiltration, nutrient cycling, biological activity, and input dependency together give a defensible picture; any single number can mislead.
- Test twice a season minimum: pre-sowing and post-harvest sampling lets a supplier scorecard show a trend, not a snapshot.
- Global soils are under real pressure: roughly a third of the world's soils are already degraded, according to the Frontiers review of soil health monitoring, which is why farm-level proof now matters more than broad claims.
- Certification alone isn't proof of soil change: a standard tells you a process was followed; a soil test tells you what actually happened underground.
- Interpret locally: a healthy soil organic carbon range in black cotton soil in Maharashtra differs from sandy loam in Bangladesh, so scorecards need regional baselines, not one national target.
At a Glance: The Six Soil Health Indicators
| Indicator | What It Measures | Typical Testing Method | Testing Frequency |
|---|---|---|---|
| Soil organic carbon | Stored carbon and long-term fertility | Lab combustion or wet oxidation test | Every 1-2 seasons |
| Soil structure | Aggregate stability and compaction depth | Penetrometer, slake test | Twice a season |
| Water infiltration | How fast and how much water soil absorbs | Ring infiltrometer | Once a season |
| Nutrient availability | N-P-K and micronutrient levels in reachable form | Soil nutrient panel | Every 1-2 seasons |
| Biological activity | Microbial biomass and earthworm presence | Microbial biomass carbon test, earthworm counts | Once a season |
| Input dependency | Trend in synthetic fertilizer and pesticide use per acre | Farmer input logs | Every season |
Why Regenerative Claims Need Farm-Level Proof
Sourcing teams now hear "regenerative" from almost every cotton supplier. The word alone tells a buyer nothing about what changed in the ground. A supplier can rotate crops, skip tillage, or plant cover crops and still show no measurable gain in soil organic carbon after three years.
That gap between practice and outcome is exactly what a growing field of measurement frameworks is trying to close. WBCSD's work on regenerative agriculture outcomes has aligned member companies around a shared set of core environmental and economic indicators, including soil organic carbon, precisely because buyers kept asking for comparable numbers instead of competing claims.
Brands facing EU CSRD disclosure requirements need the same thing: farm-level data that survives an audit, not a supplier's word. Our guide on how brands verify farm-level carbon insetting claims covers the audit trail side of this problem. This article focuses on the underlying soil data itself.
1. Soil Organic Carbon: The Foundation Metric
Soil organic carbon (SOC) tells a brand how much carbon a field has locked into stable organic matter, and it is the single best predictor of long-term fertility and drought resilience in cotton soils. Rising SOC over two or more seasons is the clearest sign regenerative practices are working.
Labs test SOC through combustion or wet oxidation methods on soil cores taken from a consistent depth, usually 0-15cm and 15-30cm. A single reading means little. What matters is the trend across seasons at the same plots, tested at the same depth and time of year.
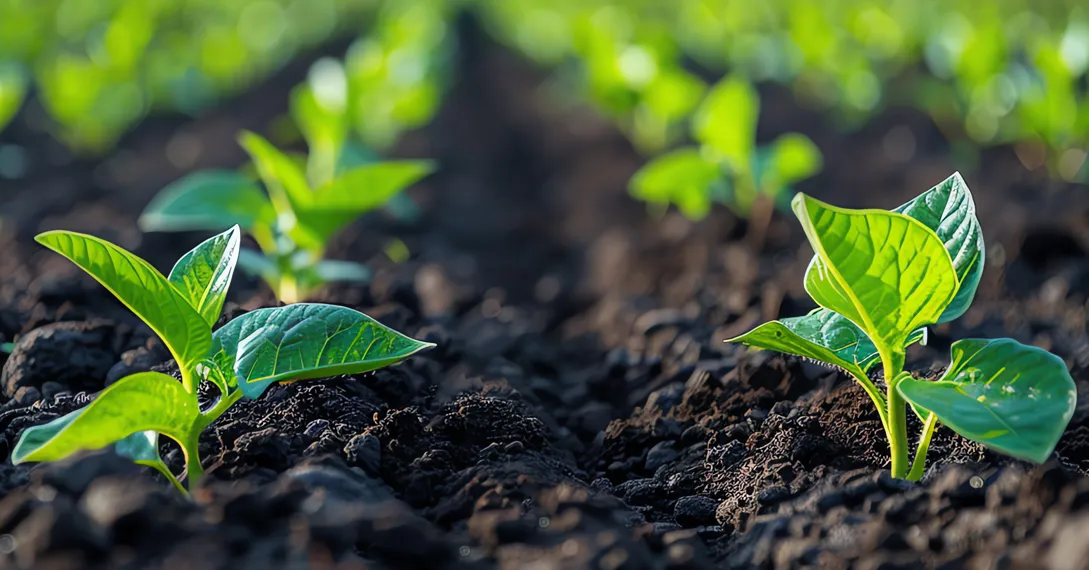
Improvement looks like a gradual rise, often a fraction of a percentage point per year in row-crop systems, not a dramatic jump. A supplier claiming doubled SOC in one season should raise questions rather than applause. Our piece on what KPIs to track in a regenerative cotton program breaks down how SOC fits alongside yield and income metrics on a supplier scorecard.
2. Soil Structure and Aggregate Stability
Soil structure tells you whether roots, water, and air can actually move through the ground, and it is measured through aggregate stability tests and compaction depth readings taken with a simple penetrometer. Cotton's taproot needs loose, crumbly soil to reach moisture during dry spells.
A slake test is one of the cheapest field checks available. A field team drops a dry soil clod into water and watches whether it holds together or collapses. Soil that holds its shape for minutes signals strong aggregate stability built by root networks and organic matter. Soil that dissolves in seconds signals compaction and low biological glue.
Compaction depth, measured with a penetrometer pushed into the soil until it meets resistance, should decrease over seasons under reduced tillage and cover cropping. A rising compaction layer, even alongside good surface indicators, warns that machinery traffic or heavy tillage is undoing gains lower in the profile.
3. Water Infiltration and Retention Rates
Water infiltration rate measures how quickly rainfall or irrigation soaks into soil rather than running off or pooling, and it is tested with a simple ring infiltrometer pushed into the ground while a timer tracks water absorption. Faster, more even infiltration means the soil is storing water for the crop instead of losing it to runoff.
Field teams press a metal ring into moist soil, pour in a measured volume of water, and record how long it takes to disappear. Repeated over several seasons at the same plot, this test shows whether structural improvements are actually translating into better water-holding capacity.

This indicator matters directly to water-stressed cotton and paddy regions across India and Bangladesh, where both drought and sudden monsoon flooding are common. Farms using regenerative practices that reverse soil degradation typically show steadier infiltration rates across both dry and wet seasons, which reduces a farmer's dependence on emergency irrigation.
4. Nutrient Availability and Cycling
Nutrient availability measures how much nitrogen, phosphorus, potassium, and key micronutrients a plant can actually access, not just how much exists in the soil in a locked, unusable form. A standard soil nutrient panel from any agricultural lab reports this in parts per million alongside pH and cation exchange capacity.
Rising nutrient availability alongside falling synthetic fertilizer application is the pattern brands should look for. It shows the soil's own biology, rather than bagged fertilizer, is doing more of the work of feeding the crop. A field stuck at the same nutrient levels despite heavy fertilizer use signals poor cycling and wasted input cost.
Micronutrients like zinc and boron deserve specific attention in cotton, since deficiencies here show up as poor boll formation before they show up in a general soil test. A supplier scorecard should track these separately rather than folding them into a single "soil fertility" score.
5. Biological Activity: Microbial Biomass and Earthworm Counts
Biological activity measures the living engine of the soil through microbial biomass carbon tests and simple earthworm counts, and it predicts nutrient cycling and structure gains before they show up in slower-moving indicators like SOC. More microbial mass and more earthworms per square meter mean a soil is actively building fertility, not just holding onto old organic matter.
Microbial biomass testing requires a lab, using fumigation-extraction methods to estimate the carbon locked in living microorganisms. It's a more sensitive early-warning indicator than SOC, often shifting within a single season of changed practice.
Earthworm counts are a field-level proxy any trained technician can run. Dig a 30cm cube of soil, count the worms, repeat at several points in a field, and average the result. Rainforest Alliance's Regenerative Agriculture Standard, launched as an add-on to its existing Sustainable Agriculture Standard, builds soil health and biodiversity requirements directly into farm-level certification, and biological activity indicators like this sit at the center of that approach.
6. Input Dependency Trend Over Time
Input dependency tracks how much synthetic fertilizer and pesticide a farmer applies per acre each season, and a falling trend alongside stable or rising yield is the strongest financial proof that soil regeneration is working. This is the indicator that connects soil science directly to farmer income and brand cost exposure.
Field to Market's regenerative agriculture measurement guidance frames this kind of input tracking as part of a broader continuous-improvement approach that lets farmers voluntarily log practices and production efficiency over time, rather than being judged against a single fixed benchmark.
Brands should ask suppliers for input logs per acre, not just a claim that "chemical use is reduced." A cooperative that can show three consecutive seasons of falling nitrogen application, alongside flat or improving yield, gives a brand real evidence for a sourcing claim.
How to Read These Indicators in Local Context
None of these six numbers means much in isolation. A soil organic carbon reading of 0.6% might represent strong progress in sandy soil that started at 0.3%, and poor performance in black cotton soil that should sit well above 1%. Always compare a farm against its own baseline and its own regional soil type, not a single national target.
Seasonal weather also swings short-term readings. A dry season can temporarily lower microbial activity and infiltration numbers even on a well-managed farm. That's why every reputable measurement framework, including the multi-domain KPI approach used across European regenerative networks, organizes indicators into interconnected domains rather than judging any single metric on its own. Brands should ask for at least three seasons of data before drawing conclusions about supplier performance.
Building Indicators into Supplier Scorecards and Audits
A workable supplier scorecard turns these six indicators into a simple pass, watch, or flag status per field, updated each season and tied to a named farmer or plot ID. That structure is what makes the data auditable rather than anecdotal.

This is where soil data has to connect to traceability. A soil test result attached to a generic "cooperative average" is far weaker evidence than one linked to a specific, geotagged plot inside an MRV system. Our detailed walkthrough on soil testing as a brand validation tool for regenerative claims covers how to structure that plot-level linkage for audit purposes.
At Beetle Regen, we build soil sampling schedules directly into our farmer training and MRV systems across our cotton programs in India and Bangladesh, so a brand receives dated, geotagged soil data alongside the farmer income and yield figures already in a supplier's traceability record. That combination is what turns a regenerative sourcing claim into something a compliance team can actually defend.
Frequently Asked Questions
How often should a supplier test soil health indicators?
Test soil organic carbon and nutrient panels every one to two seasons, and check structure, infiltration, and biological activity once or twice per season. Consistent timing and depth across tests matters more than testing frequently but inconsistently.
What does real improvement look like across these indicators?
Real improvement is a gradual, multi-season trend across several indicators together, such as rising organic carbon and falling input use with steady yield. A single season's improvement in one metric, without corroborating movement in the others, is not enough to support a sourcing claim.
Do these indicators replace certification standards?
No. Certification confirms a farm follows an approved process; soil indicators confirm what actually changed underground. Brands get the strongest evidence base by pairing a recognized standard with their own farm-level soil data, rather than relying on either alone.
Turn Soil Data into a Defensible Sourcing Story
Brands that ask suppliers for these six indicators, tracked over real seasons and tied to named farms, get something a certificate alone cannot provide: proof. That proof protects a sustainability claim in front of a regulator, a retail buyer, or an internal audit committee, and it gives farmers credit for the work they're actually doing in the field.
Beetle Regen works with cotton farmers, ginners, and textile brands across India and Bangladesh to build soil health testing directly into regenerative sourcing programs, backed by MRV and traceability systems that hold up under scrutiny. If your sourcing team wants to move from broad regenerative claims to a scorecard with real numbers behind it, contact us to talk through what a measurable soil-to-supply-chain program could look like for your supply base.